Using log based metrics to send alerts in GCP
Google Cloud Platform contains several products for keeping track of your apps and alerting when things go south. In this article I will link a couple of products together to use this built-in alerting functionality in your own application.
In order to send alerts, we need monitoring. To monitor we need metrics. The metrics we need will come from logs. The Cloud Logging and Monitoring components of GCP were formerly know as Stackdriver. They rebranded it to Google Cloud Operation’s suite.
When opening Cloud Monitoring, you will see a couple of default dashboards already available depending on what products you already use. GCP monitors the state of the components in your project such as the Compute Instances, Load Balancers, GKE clusters, Cloud SQL instances, …

You can build your own custom dashboards using the metrics provided and set up alerting accordingly.
These metrics come from either the GCP backend or an agent running on your VM/container/… You can even build custom metrics if you want!
But what if you want to use this Cloud Monitoring to know when your app is in trouble? When some part fails to do it’s job but it’s not related to resource starvation, connection issues or something already covered in the default metrics?
In come the log based metrics. With this feature you can monitor the GCP logs and use them as a metric in Cloud Monitoring. To illustrate how you can use this, I will share my last use case: the failed backup
Use Case: The failed backup
One of the projects I’m involved with has a GKE cluster with a couple of dozen workloads. Each of them have some sort of configmap or a kubernetes secret that provides the container with its specific configuration.
In order to safeguard all those resources, I’ve setup Velero to backup everything on a daily basis. If you want to set this up yourself on GKE, follow the GCP plugin guide.
Velero outputs it’s logs to stdout, which are caught by Cloud Logging. After installation completed, the backup and logs were created.

All is fine. But what if it isn’t? How can I detect failure of a component that has no built-in notification system. Sure, it will fill the logs with errors but how long before we’d notice? I’d rather not leave this up to chance.
Each GCP component sends it’s log data to Cloud Logging. In Logging Explorer you can easily filter and search for output across your entire project. The logging can become overwhelming in bigger projects so make sure to get comfortable with the different filtering options to get what you’re looking for.
To detect a failed backup, we create a filter that only includes that specific log entry. In this case it would look like this:

Make sure it’s specific enough so it doesn’t trigger false positives. Run the query to check.
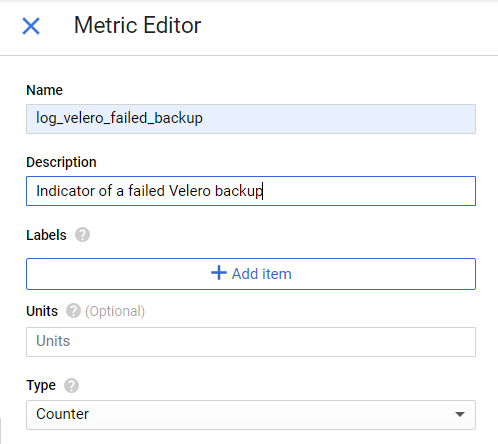
Next step is to create a metric from this filter. In the Logging Explorer, go to the Actions button and select ‘Create Metric’

Provide your custom metric with a meaningful name.

When you create a log based metric, it will populate for all future occurrences of the log entry. So don’t worry if there are no results in the alert policy for now.
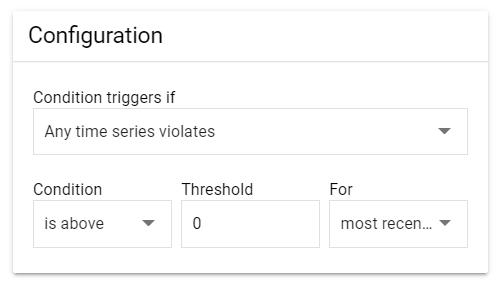
The final step is to create an alert for when metric crosses a threshold. Go over to Monitoring > Alerting and create a new policy. Add a condition and fill in your custom metric. All log based metrics start with logging/user/

Define the alert trigger as needed. In this case I want to send an alert every time a backup fails (Threshold > 0).

Choose your notification channel. If you haven’t used alerting up until now, you will need to set this up first. I chose email.
Time for a test. I revoked Velero’s access to my storage bucket and requested a new backup. Moments later, I received this email:

Looking good!
Conclusion
By using only built-in components to monitor applications we can aggregate all information in Cloud Logging and use Monitoring to quickly correlate application logs with other infrastructure metrics.
The example above illustrates how easy it is to alert on the things you want. It doesn’t matter if your app runs on a Compute Instance, Cloud Run, App Engine. If it sends logs to Cloud Logging, you can create a metric for it. Custom alerting without having to setup any infrastructure at all or use an external service!
Thanks for reading! If you ever want to chat on building awesome cloud stuff, ping us at www.vbridge.eu
